Data Engineering
Freight Carrier Performance & Cost Analytics Platform
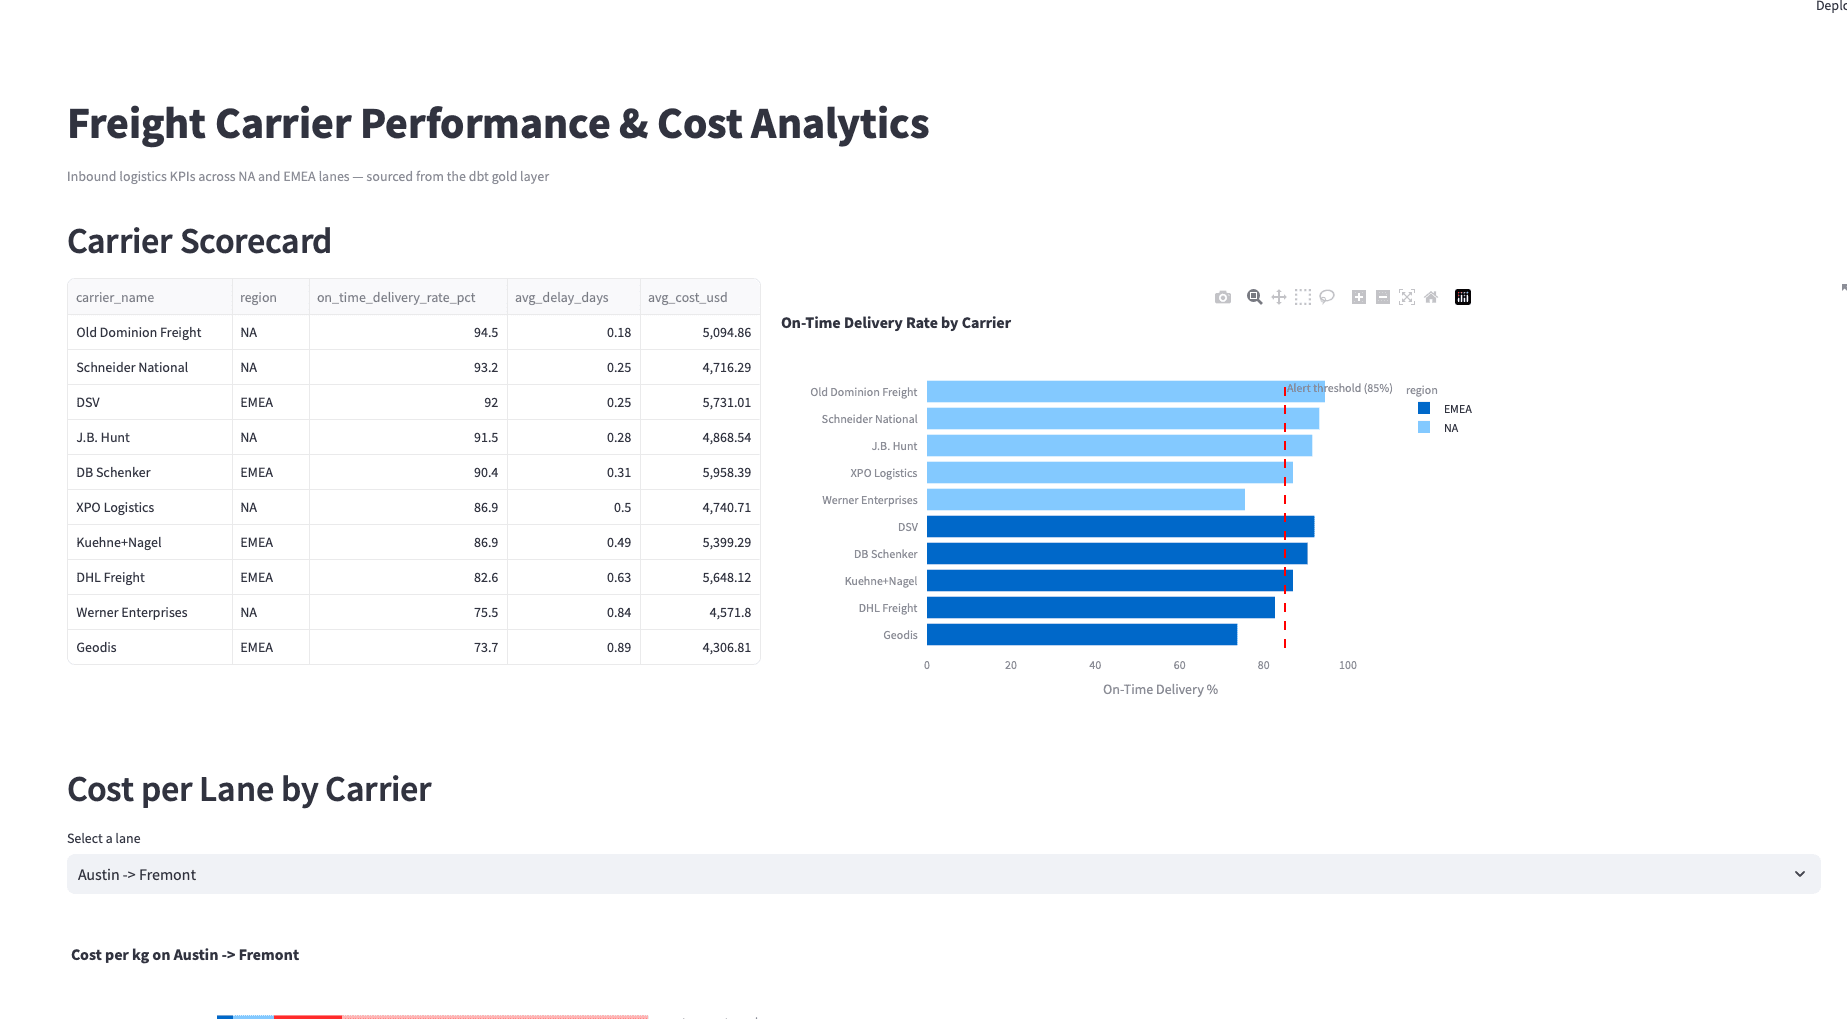
A production-style analytics platform for inbound logistics. Shipment data flows through a Postgres warehouse and a dbt medallion architecture (bronze to silver to gold), is orchestrated on a daily Airflow DAG, and surfaces in a Streamlit dashboard with carrier scorecards, on-time delivery rankings, and lane cost comparisons. CI runs the full pipeline on every push via GitHub Actions.
Screenshots
Problem Statement
Inbound logistics teams need to answer three questions constantly: which carriers are underperforming, which lanes are overpriced, and what a carrier switch would actually save. Answering them usually means stitching together spreadsheets from separate systems, which makes the analysis slow, manual, and stale by the time it reaches a decision. This platform was built to answer all three from a single orchestrated pipeline.
Tech Stack
Key Contributions
- Generated synthetic multi-carrier shipment data with Faker and SQLAlchemy across North America and EMEA lanes, with deliberate performance variance baked in, and loaded it into PostgreSQL
- Modeled the warehouse in dbt using a medallion architecture: bronze for raw landing, silver for cleaned and typed shipment records with delay flags, and gold for business-facing marts covering carrier KPIs, lane cost aggregates, and exception rollups
- Orchestrated a daily Airflow DAG chaining data generation, dbt run, dbt test, and a carrier exception check that flags carriers breaching the on-time threshold
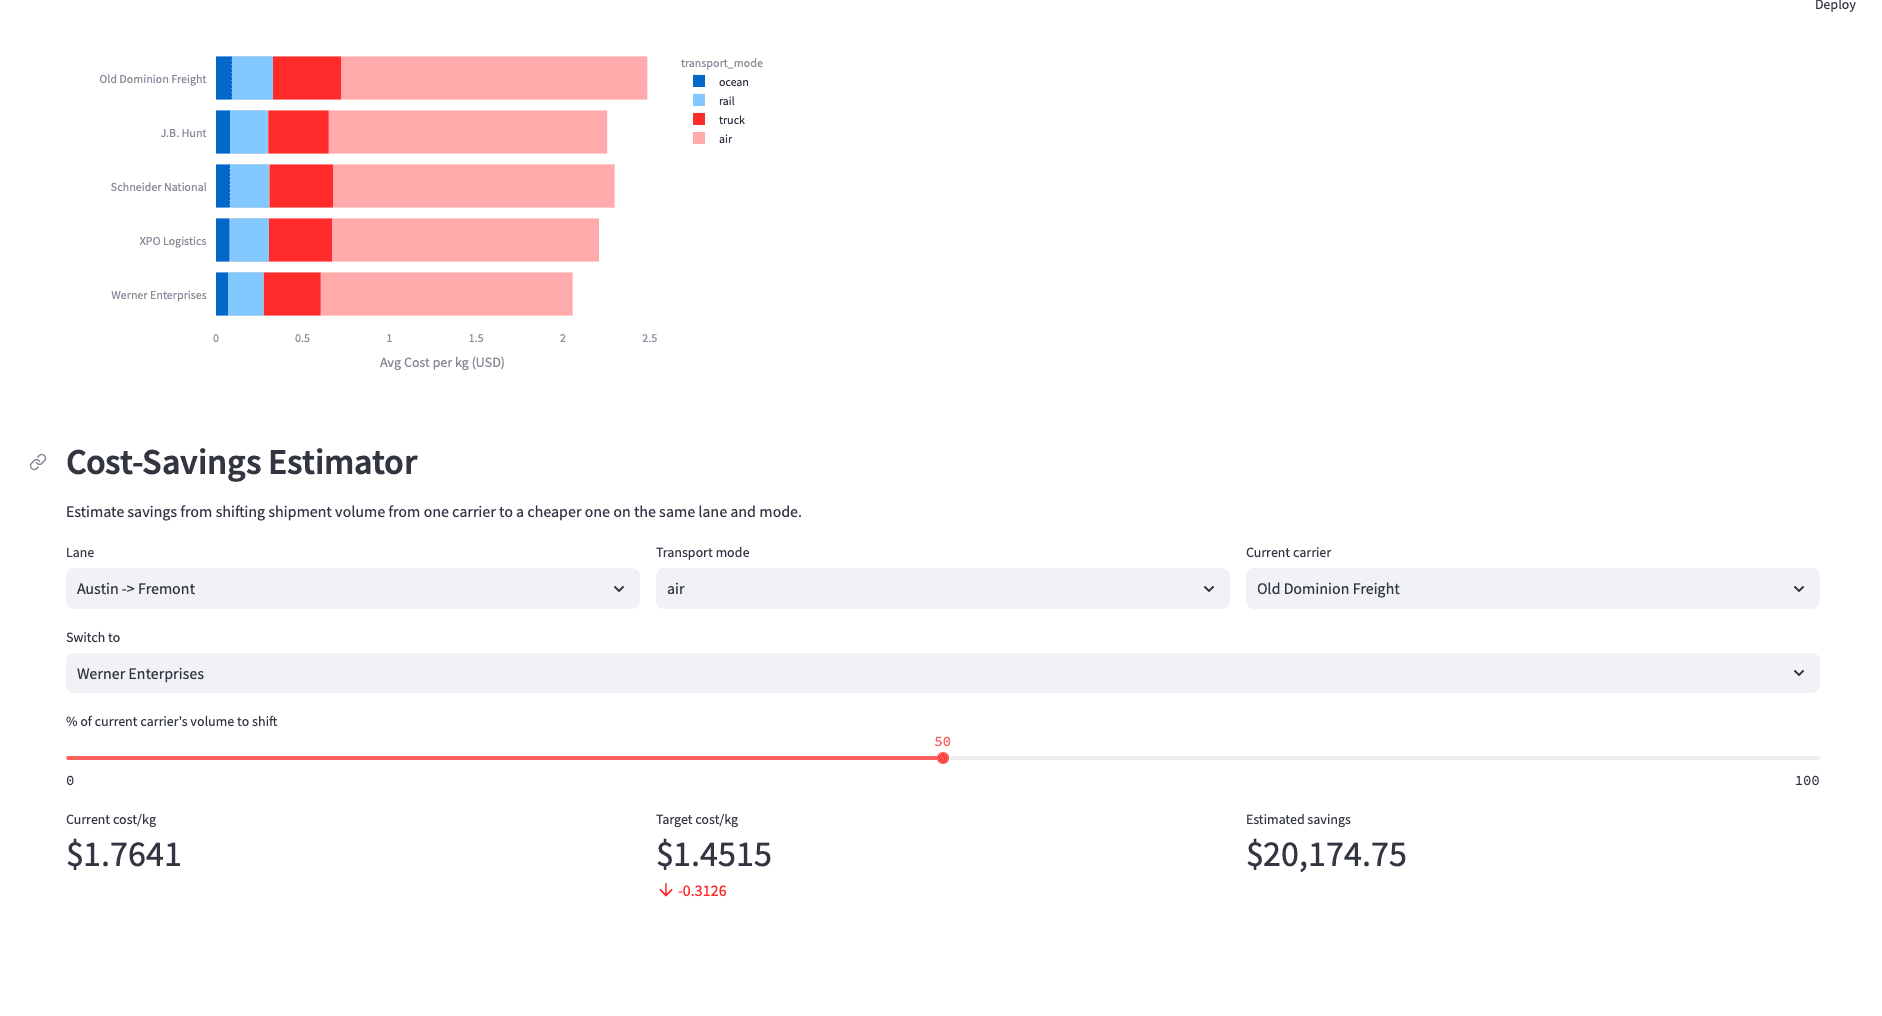
- Built a Streamlit dashboard on the gold layer with a carrier scorecard, an on-time delivery ranking with a configurable alert threshold, a lane-by-lane cost comparison, and an interactive cost-savings estimator
- Set up GitHub Actions CI that provisions a Postgres service, applies the schema, generates data, and runs the full dbt build on every push
Results
- Carrier on-time performance and cost per shipment ranked and comparable from a single gold-layer mart
- Lane-level cost comparison across North America and EMEA surfaces overpriced lanes without manual reconciliation
- Interactive cost-savings estimator models the dollar impact of shifting shipment volume between carriers
- Data quality tests run at every layer, so a bad upstream load fails the DAG instead of reaching the dashboard
Engineering Decisions
- Chose a medallion architecture over a single transformation step so raw data stays auditable and each layer can be tested independently
- Ran Airflow and dbt in isolated virtual environments due to hard SQLAlchemy and typing-extensions conflicts, with Airflow invoking dbt through BashOperator using explicit binary paths
- Pushed the exception check into the DAG rather than the dashboard, so threshold breaches are caught by the pipeline instead of depending on someone opening a page
- Built CI to provision a real Postgres service rather than mocking the warehouse, so a green build means the pipeline actually runs end to end
Challenges Faced
- Airflow and dbt could not share a Python environment due to conflicting SQLAlchemy and typing-extensions pins, which required subprocess-based orchestration across separate virtualenvs with explicit binary paths
- Synthetic data had to be realistic enough to be useful. Carriers needed genuine performance variance and lane-level cost spread, otherwise every KPI came out flat and the dashboard proved nothing
- Reproducing the full pipeline in CI meant provisioning Postgres, applying schema, seeding data, and running dbt build inside a clean runner on every push